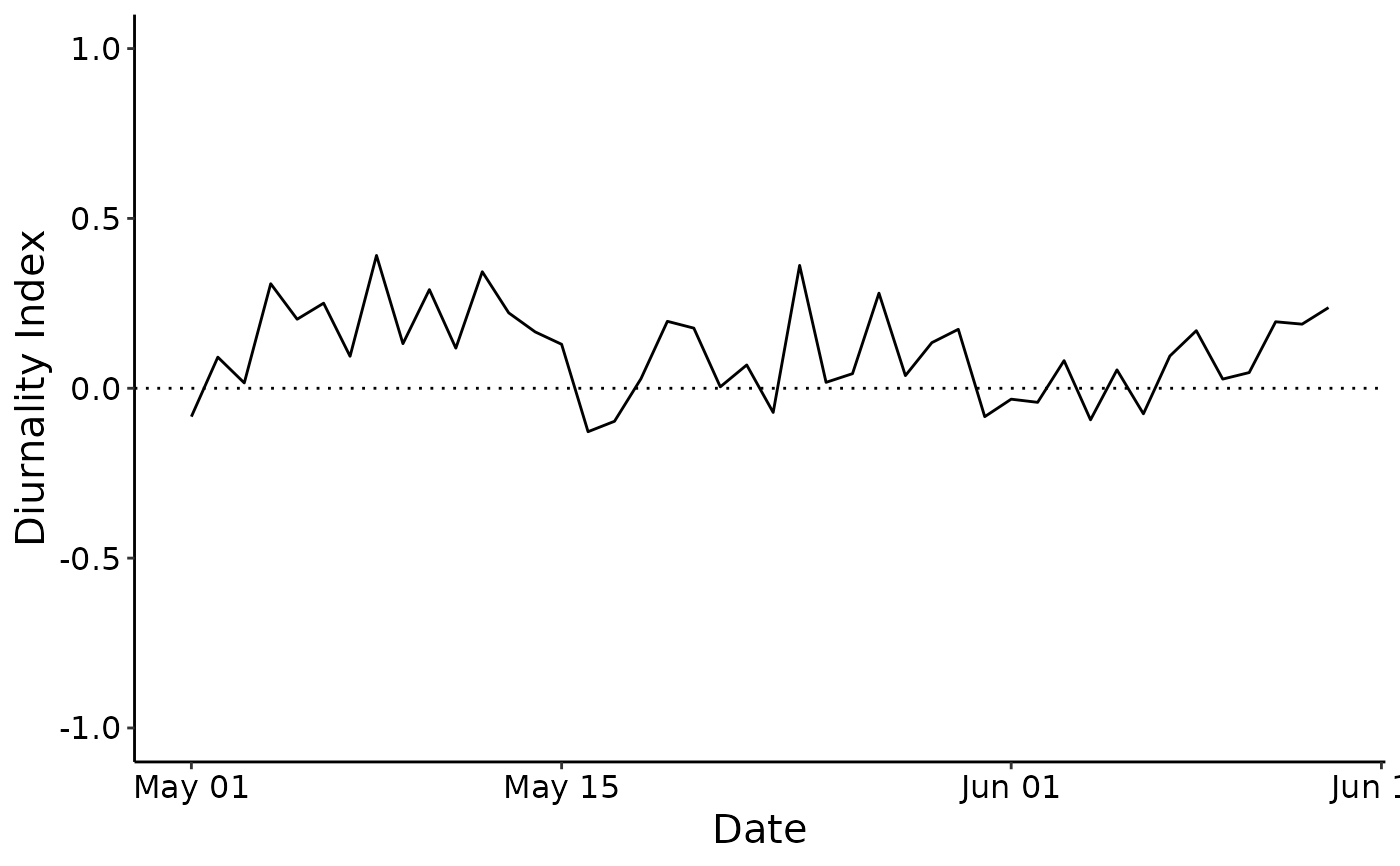
Computes the diurnality index, using different start and end definitions for each day and night, based on an activity dataframe
sliding_DI.RdComputes the diurnality index, using different start and end definitions for each day and night, based on an activity dataframe
Arguments
- data
a digiRhythm-friendly dataset
- activity
The number of non-useful lines to skip (lines to header)
- timedata
a dataset, including 4 columns of POSIXct format, including date and time "day_start", "day_end", "night_start", "night_end"
- save
if NULL, the image is not saved. Otherwise, this parameter will be the name of the saved image. it should contain the path and name without the extension.
Value
A ggplot2 object that contains the Sliding diurnality plot in addition to a dataframe with 2 col: date and sliding diurnality index
Examples
data("df516b_2", package = "digiRhythm")
data <- df516b_2
data <- remove_activity_outliers(data)
activity <- names(data)[2]
data("timedata", package = "digiRhythm")
timedata <- timedata
d_index <- sliding_DI(data, activity, timedata)