Plot daily average over a period of time for a specific variable.
daily_activity_wrap_plot.RdTakes an activity dataset as input and plot and save the daily average of the specified activity column
Usage
daily_activity_wrap_plot(
  df,
  activity,
  activity_alias,
  start,
  end,
  sampling_rate,
  ncols,
  save = "daily_wrap_plot"
)
Arguments
- df
The dataframe containing the activity data
- activity
the name of activity
- activity_alias
A string containing the name of the activity to be shown on the graph.
- start
The start day (in "%Y-%m-%d" format).
- end
The end day (in "%Y-%m-%d" format).
- sampling_rate
the sampling rate of the data.
- ncols
the number of columns to spread the graphs on. be the name of the saved image. it should contain the path and name without the extension.
- save
if NULL, the image is not saved. Otherwise, this parameter will
Examples
data("df516b_2")
df <- df516b_2
activity <- names(df)[2]
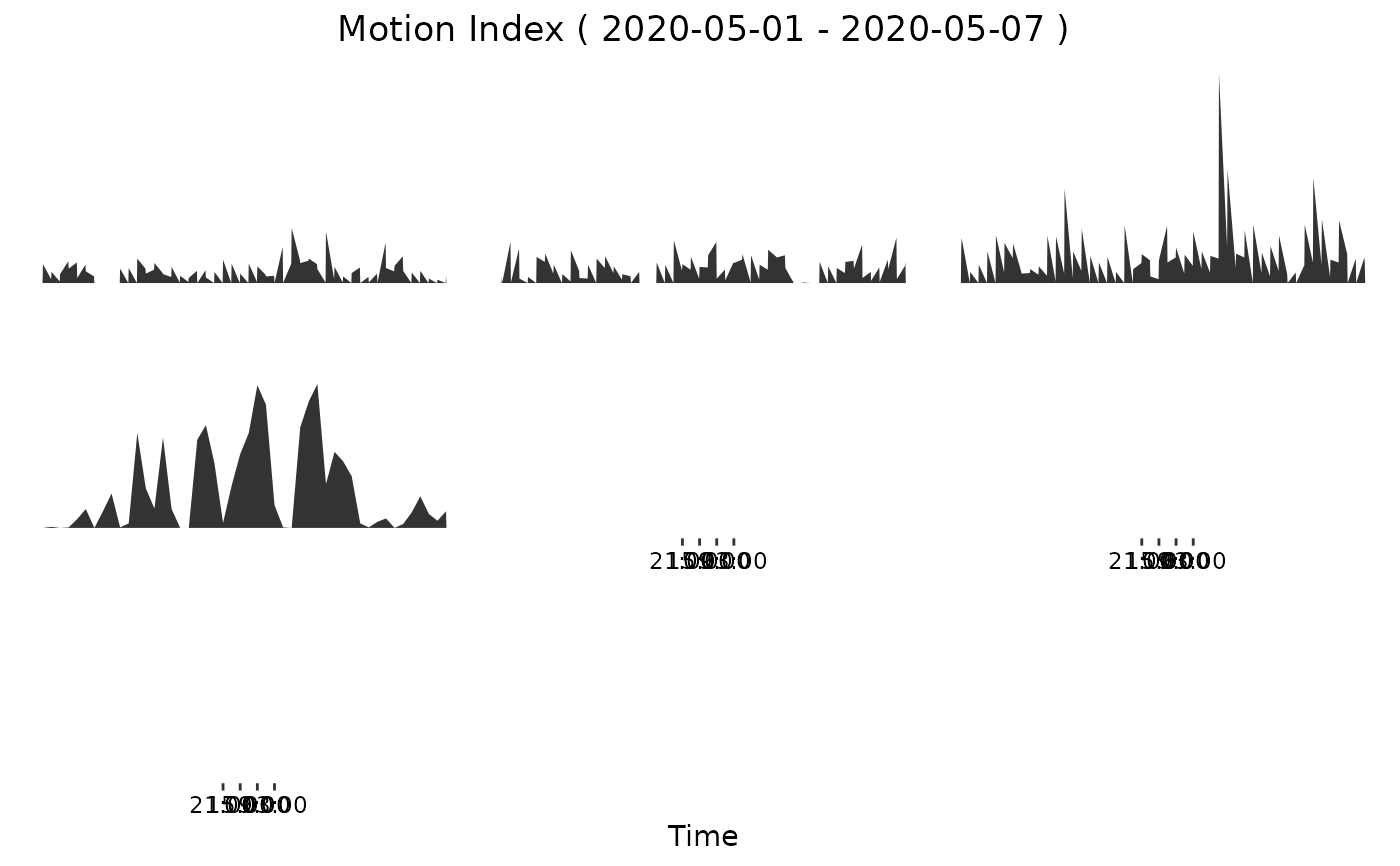
activity_alias <- "Motion Index"
start <- "2020-05-01" # year-month-day
end <- "2020-05-07" # year-month-day
ncols <- 3
sampling_rate <- 30
my_dwp <- daily_activity_wrap_plot(
df, activity, activity_alias, start, end, sampling_rate,
ncols
)
#> Warning: Removed 336 rows containing non-finite outside the scale range
#> (`stat_align()`).