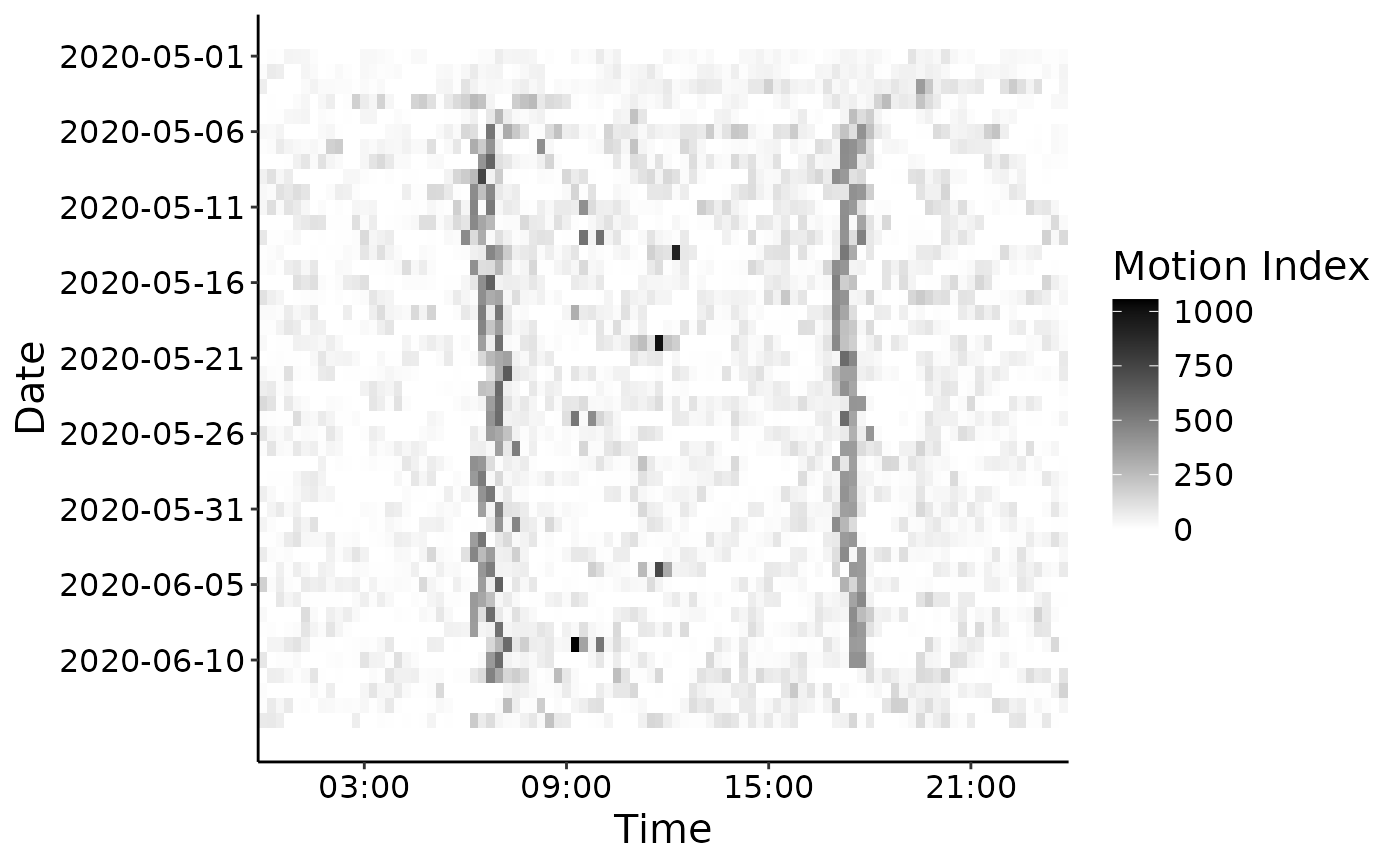
Plot a an single actogram over a period of time for a specific variable
actogram.RdTakes an activity dataset as input and plot and save an actogram of the specified activity column
Arguments
- df
The dataframe containing the activity data
- activity
the name of activity
- activity_alias
A string containing the name of the activity to be shown on the graph.
- start
The start day (in "%Y-%m-%d" format).
- end
The end day (in "%Y-%m-%d" format).
- save
if NULL, the image is not saved. Otherwise, this parameter will be the name of the saved image. it should contain the path and name without the extension.